Photovoltaic Curve (I-V Curve) Analysis in Solar Panel Diagnostics: The Game-Changing Method for Detecting and Solving Solar Power Problems. Discover How This Advanced Technique Transforms Solar Panel Maintenance and Efficiency.
- Introduction to Photovoltaic (I-V) Curves
- Why I-V Curve Analysis Matters in Solar Diagnostics
- Key Parameters Extracted from I-V Curves
- Common Faults Detected Through I-V Curve Analysis
- Step-by-Step Guide to Performing I-V Curve Measurements
- Interpreting I-V Curve Results: Real-World Examples
- Tools and Technologies for I-V Curve Analysis
- Best Practices for Accurate Diagnostics
- Future Trends in Solar Panel Diagnostics Using I-V Curves
- Conclusion: Maximizing Solar Panel Performance with I-V Curve Analysis
- Sources & References
Introduction to Photovoltaic (I-V) Curves
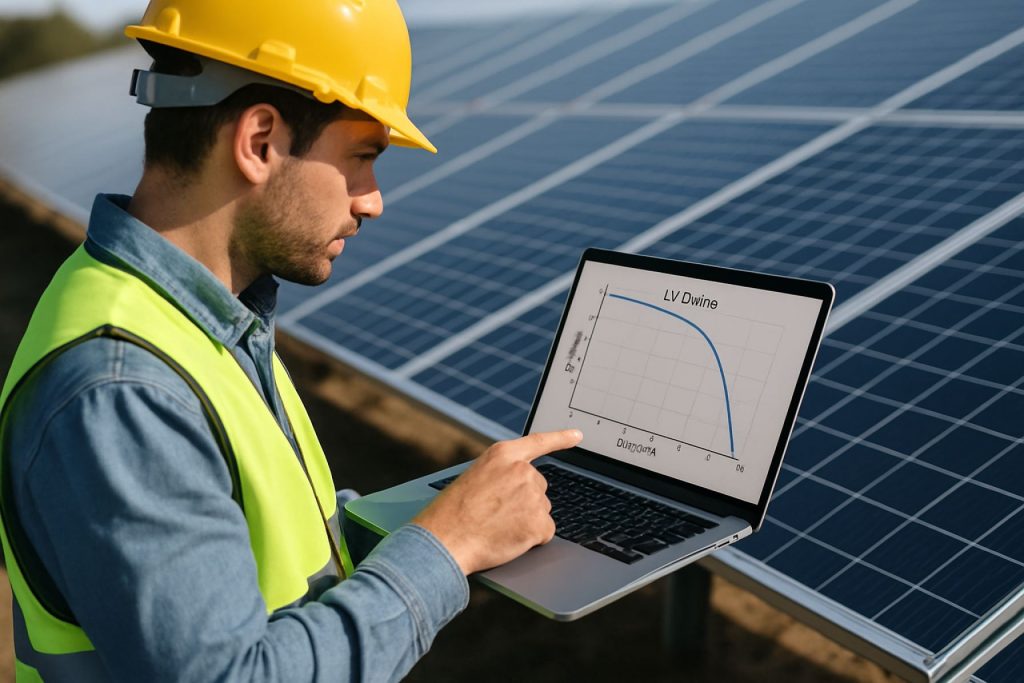
The photovoltaic current-voltage (I-V) curve is a fundamental diagnostic tool in assessing the performance and health of solar panels. This curve graphically represents the relationship between the output current and voltage of a photovoltaic (PV) module under specific conditions, typically measured under standard test conditions (STC). The shape and key points of the I-V curve—such as the short-circuit current (ISC), open-circuit voltage (VOC), and maximum power point (MPP)—provide critical insights into the operational efficiency and potential issues within a solar panel or array.
In solar panel diagnostics, analyzing the I-V curve allows technicians and engineers to detect a range of performance-affecting factors, including cell degradation, shading, soiling, and electrical mismatches. Deviations from the expected curve shape can indicate specific faults, such as bypass diode failures or interconnection problems. By comparing measured I-V curves to manufacturer specifications or historical data, it is possible to pinpoint underperforming modules and take corrective action, thereby optimizing system output and longevity.
Modern diagnostic equipment enables rapid, on-site I-V curve tracing, making it an essential practice in both routine maintenance and troubleshooting of PV systems. The importance of I-V curve analysis is recognized by international standards and guidelines, such as those provided by the International Electrotechnical Commission and the National Renewable Energy Laboratory, which outline best practices for accurate measurement and interpretation. As solar energy adoption grows, I-V curve analysis remains a cornerstone of effective PV system management and reliability assurance.
Why I-V Curve Analysis Matters in Solar Diagnostics
I-V curve analysis is a cornerstone in the field of solar panel diagnostics because it provides a comprehensive, real-time assessment of a photovoltaic (PV) module’s electrical performance. Unlike simple voltage or current measurements, the I-V curve captures the relationship between current (I) and voltage (V) across a range of operating conditions, revealing critical information about the health and efficiency of solar panels. This analysis enables technicians to detect subtle issues such as cell mismatches, shading effects, degradation, and connection faults that may not be apparent through standard monitoring systems.
By examining the shape and key points of the I-V curve—such as the open-circuit voltage (Voc), short-circuit current (Isc), and maximum power point (MPP)—diagnosticians can pinpoint specific performance losses and their underlying causes. For example, a reduction in Voc may indicate cell degradation or soiling, while a drop in Isc could signal shading or interconnection problems. This level of diagnostic precision is essential for maximizing energy yield, planning maintenance, and ensuring the long-term reliability of PV installations.
Furthermore, I-V curve analysis is invaluable for both commissioning new systems and troubleshooting existing arrays. It allows for baseline performance documentation and ongoing comparison, supporting warranty claims and performance guarantees. As the solar industry moves toward larger and more complex installations, the ability to quickly and accurately assess panel health using I-V curve analysis is increasingly recognized as a best practice by organizations such as the National Renewable Energy Laboratory and the International Energy Agency Photovoltaic Power Systems Programme.
Key Parameters Extracted from I-V Curves
The analysis of photovoltaic (I-V) curves is fundamental in diagnosing the performance and health of solar panels. Several key parameters are extracted from these curves, each providing critical insights into the operational status and efficiency of a photovoltaic module. The most significant parameters include the short-circuit current (ISC), open-circuit voltage (VOC), maximum power point (PMP), fill factor (FF), and series and shunt resistances (RS and RSH).
- Short-Circuit Current (ISC): This is the current measured when the output terminals are shorted (voltage is zero). It reflects the maximum current the panel can produce under standard test conditions and is sensitive to irradiance and cell degradation.
- Open-Circuit Voltage (VOC): The voltage across the terminals when no load is connected (current is zero). VOC is influenced by temperature and cell quality, and reductions may indicate cell damage or soiling.
- Maximum Power Point (PMP): The point on the curve where the product of current and voltage is maximized, representing the optimal operating condition for energy extraction.
- Fill Factor (FF): Defined as the ratio of the maximum obtainable power to the product of ISC and VOC, the fill factor is a measure of the “squareness” of the I-V curve and overall module quality.
- Series and Shunt Resistances (RS and RSH): High series resistance or low shunt resistance can indicate faults such as solder bond failures or cell cracks, and are diagnosed by analyzing the slope of the I-V curve near ISC and VOC respectively.
Accurate extraction and interpretation of these parameters are essential for effective solar panel diagnostics, as detailed by the National Renewable Energy Laboratory and the International Electrotechnical Commission.
Common Faults Detected Through I-V Curve Analysis
I-V curve analysis is a powerful diagnostic tool for identifying a range of faults in photovoltaic (PV) modules and arrays. By comparing the measured current-voltage (I-V) characteristics to the expected performance under given irradiance and temperature conditions, technicians can pinpoint specific issues that compromise system efficiency and reliability.
One of the most common faults detected is shading, which causes a distinctive “step” or “knee” in the I-V curve due to the activation of bypass diodes. This results in a sudden drop in current at certain voltage points, indicating that one or more cells are not contributing to the overall output. Cell degradation or mismatch—often due to aging, manufacturing defects, or soiling—manifests as a reduction in the fill factor and a general lowering of the curve, reflecting decreased maximum power output.
Open-circuit faults (such as broken interconnections or disconnected strings) are revealed by a sharp drop in current to zero at voltages lower than expected, while short-circuit faults (like internal cell shorts) cause a significant reduction in open-circuit voltage. Potential-induced degradation (PID) can also be detected, typically seen as a gradual loss in both current and voltage, leading to a shrunken I-V curve envelope.
These diagnostic capabilities make I-V curve analysis an essential practice for preventive maintenance and troubleshooting in PV systems, as recognized by organizations such as the National Renewable Energy Laboratory and IEA Photovoltaic Power Systems Programme.
Step-by-Step Guide to Performing I-V Curve Measurements
Performing I-V curve measurements is a critical procedure in diagnosing and evaluating the performance of solar panels. The following step-by-step guide outlines the essential process for accurate and reliable I-V curve acquisition:
- Preparation: Ensure the solar panel is clean and free from shading or obstructions. Confirm that environmental conditions, such as irradiance and temperature, are within the recommended range for testing. Use a calibrated irradiance meter and temperature sensor to record these values, as they are necessary for accurate analysis (National Renewable Energy Laboratory).
- Equipment Setup: Connect the I-V curve tracer to the solar panel’s terminals, following the manufacturer’s safety guidelines. Verify all connections are secure to prevent measurement errors or equipment damage (International Energy Agency Photovoltaic Power Systems Programme).
- Measurement Execution: Initiate the I-V curve tracer. The device will sweep the load from open-circuit voltage (Voc) to short-circuit current (Isc), recording current and voltage at multiple points. Ensure the sweep is performed quickly to minimize the impact of changing sunlight conditions.
- Data Recording: Save the measured I-V data, including environmental parameters. Many modern tracers automatically store this information for later analysis.
- Analysis: Compare the measured I-V curve to the manufacturer’s reference curve under similar conditions. Look for deviations such as reduced fill factor, lower maximum power point, or abnormal curve shapes, which may indicate faults like cell degradation, shading, or connection issues (Sandia National Laboratories).
By following these steps, technicians can systematically diagnose performance issues and ensure optimal operation of photovoltaic systems.
Interpreting I-V Curve Results: Real-World Examples
Interpreting I-V curve results is crucial for diagnosing and optimizing the performance of solar panels in real-world scenarios. For instance, a healthy photovoltaic (PV) module typically exhibits a smooth, rectangular I-V curve, with a clear maximum power point (MPP) where the product of current and voltage is maximized. Deviations from this ideal shape can indicate specific issues. For example, a significant reduction in the short-circuit current (ISC) often points to soiling, shading, or cell degradation, while a drop in open-circuit voltage (VOC) may suggest potential-induced degradation (PID) or shunting faults National Renewable Energy Laboratory.
In field diagnostics, partial shading is a common real-world issue. This typically manifests as multiple steps or “knees” in the I-V curve, corresponding to the activation of bypass diodes that protect shaded cells. Such patterns help technicians pinpoint the location and extent of shading or cell mismatch Sandia National Laboratories. Similarly, a sudden drop in the fill factor (the ratio of actual maximum obtainable power to the theoretical power) can indicate increased series resistance, often due to corroded contacts or damaged interconnections.
By systematically comparing measured I-V curves to baseline or manufacturer-provided curves, technicians can identify and localize faults, estimate performance losses, and prioritize maintenance actions. This approach is widely adopted in both utility-scale and rooftop PV installations, ensuring reliable energy yield and extending system lifespan International Energy Agency Photovoltaic Power Systems Programme.
Tools and Technologies for I-V Curve Analysis
Modern photovoltaic (PV) diagnostics rely heavily on advanced tools and technologies for accurate I-V curve analysis. The cornerstone of this process is the I-V curve tracer, a specialized instrument designed to measure the current and voltage output of solar panels under varying load conditions. These devices can be handheld for field use or integrated into larger monitoring systems for continuous assessment. Leading manufacturers such as Fluke Corporation and Seaward Group offer portable I-V curve tracers that provide real-time data, enabling technicians to quickly identify issues such as shading, soiling, or cell degradation.
In addition to hardware, software platforms play a crucial role in data analysis and visualization. These platforms often feature automated curve fitting, fault detection algorithms, and historical data comparison, streamlining the diagnostic process. Cloud-based solutions, such as those provided by Solar-Log GmbH, allow for remote monitoring and analysis, facilitating large-scale PV system management.
Emerging technologies are further enhancing I-V curve analysis. Drone-based systems equipped with I-V measurement tools and thermal imaging cameras can rapidly assess large solar farms, pinpointing underperforming modules with high precision. Integration with artificial intelligence and machine learning algorithms is also on the rise, enabling predictive maintenance and more accurate fault classification. These advancements collectively improve the efficiency, accuracy, and scalability of PV diagnostics, supporting the long-term reliability of solar energy systems.
Best Practices for Accurate Diagnostics
Accurate diagnostics of solar panels using Photovoltaic (I-V) curve analysis requires adherence to several best practices to ensure reliable and actionable results. First, environmental conditions must be carefully controlled or compensated for during testing. Irradiance and temperature significantly affect I-V characteristics; thus, measurements should ideally be performed under standard test conditions (STC) or corrected using reference cells and temperature sensors to normalize data National Renewable Energy Laboratory.
Proper instrumentation is critical. High-quality I-V curve tracers with regular calibration minimize measurement errors. The use of four-wire (Kelvin) connections is recommended to reduce the impact of lead resistance, especially in large or high-current modules International Electrotechnical Commission. Additionally, ensuring clean and secure electrical contacts prevents spurious readings.
Panel isolation is another key practice. Disconnecting the module from the array and bypassing any power electronics (such as inverters or optimizers) avoids interference and ensures the measured curve reflects the true module performance. It is also important to inspect for shading, soiling, or physical damage prior to testing, as these factors can distort the I-V curve and lead to misdiagnosis.
Finally, systematic documentation and comparison with manufacturer datasheets or historical data enable the identification of degradation trends or emerging faults. Utilizing specialized software for curve analysis can further enhance diagnostic accuracy by automating anomaly detection and reporting Sandia National Laboratories.
Future Trends in Solar Panel Diagnostics Using I-V Curves
The future of solar panel diagnostics is poised for significant advancements through the integration of sophisticated I-V curve analysis techniques. Emerging trends focus on leveraging artificial intelligence (AI) and machine learning (ML) to automate the interpretation of I-V curves, enabling rapid identification of subtle performance degradations and fault patterns that may be missed by traditional methods. These intelligent systems can process large datasets from field-deployed panels, learning to distinguish between issues such as soiling, shading, cell mismatch, and degradation, thereby improving maintenance efficiency and reducing downtime.
Another key trend is the development of real-time, in-situ I-V curve measurement tools that can be embedded within solar arrays. These systems provide continuous monitoring without interrupting energy production, allowing for immediate detection of anomalies and more precise localization of faults. Integration with Internet of Things (IoT) platforms further enhances remote diagnostics, enabling centralized monitoring of geographically dispersed installations and facilitating predictive maintenance strategies.
Additionally, advances in sensor technology and data analytics are enabling more granular diagnostics at the module and even cell level. This granularity supports early intervention, prolonging system lifespan and optimizing energy yield. Standardization efforts, such as those led by the International Electrotechnical Commission, are also shaping the future by ensuring interoperability and data consistency across diagnostic platforms.
Collectively, these trends are transforming I-V curve analysis from a periodic, manual process into a continuous, intelligent, and highly automated diagnostic tool, supporting the reliability and scalability of solar energy systems worldwide.
Conclusion: Maximizing Solar Panel Performance with I-V Curve Analysis
In conclusion, I-V curve analysis stands as a cornerstone in the effective diagnostics and optimization of solar panel performance. By systematically measuring the current-voltage relationship under controlled conditions, technicians and engineers can pinpoint issues such as cell degradation, shading effects, connection faults, and mismatches within photovoltaic arrays. This diagnostic approach enables early detection of performance losses, allowing for timely maintenance and minimizing energy yield reductions. Furthermore, regular I-V curve testing supports predictive maintenance strategies, extending the operational lifespan of solar installations and safeguarding return on investment.
The integration of advanced I-V curve analyzers and digital monitoring platforms has further enhanced the accuracy and efficiency of diagnostics, providing real-time data and trend analysis for large-scale solar farms. These technological advancements facilitate data-driven decision-making, ensuring that solar assets operate at their maximum potential. As the solar industry continues to expand, the adoption of standardized I-V curve analysis protocols, as recommended by organizations such as the National Renewable Energy Laboratory and the International Energy Agency Photovoltaic Power Systems Programme, will be crucial for maintaining high performance and reliability across diverse climatic and operational conditions.
Ultimately, leveraging I-V curve analysis not only maximizes energy output but also contributes to the long-term sustainability and economic viability of solar power systems, reinforcing its essential role in the ongoing transition to renewable energy.
Sources & References
- National Renewable Energy Laboratory
- Sandia National Laboratories
- Fluke Corporation
- Seaward Group
- Solar-Log GmbH


