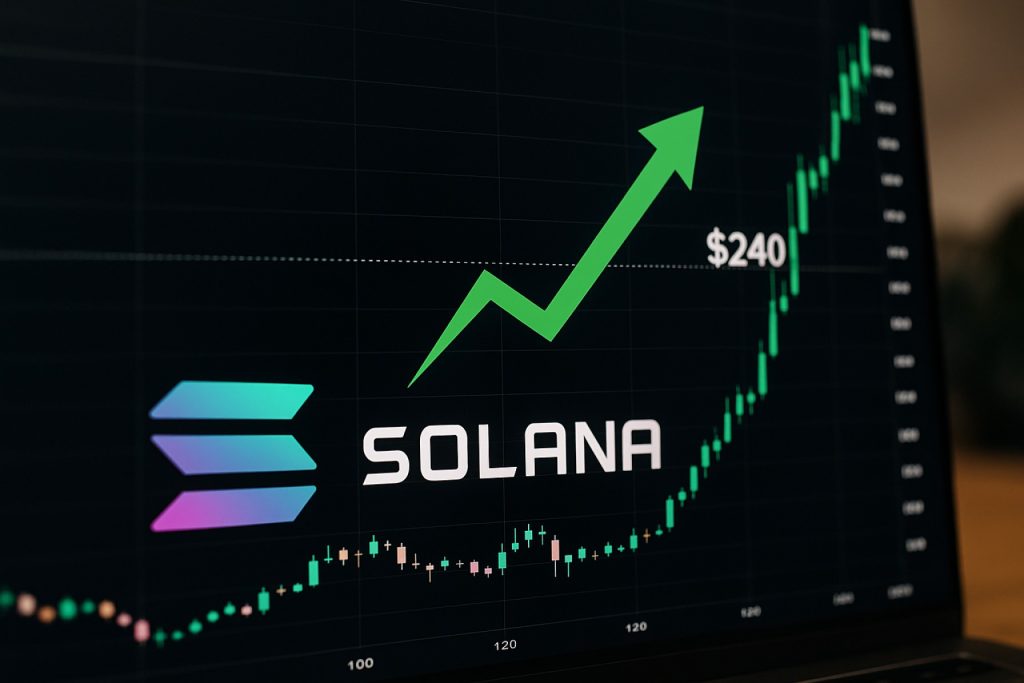
Solana consolidates near crucial support, technicals hint at a breakout. Could SOL hit $240 soon? Here’s what to watch right now.
| Current Resistance | $176 (200-Day MA & Point of Control) |
| Major Support | $156–$160 (0.618 Fibonacci) |
| Potential Breakout Target | $240 (Value Area High) |
Solana (SOL) is making waves again. The crypto powerhouse is showing classic signs of an imminent breakout—bouncing off ironclad support levels, building bullish momentum, and consolidating in a tight zone that has traders on high alert. The charts are flashing green: if SOL can smash through one more resistance, the path to $240 could open fast.
—
Q: Is Solana Gearing Up for a Major Rally?
All eyes are on Solana’s price action. The asset has decisively defended the coveted 0.618 Fibonacci retracement, attracting a swarm of buyers and igniting hopes for another leg up. This rebound aligns with a cluster of technical supports—VWAP, a pivotal swing low, and a high-confluence demand zone around $156–$160.
Recent trading has seen SOL print higher highs and higher lows, painting a textbook uptrend. Each dip is being scooped up aggressively, suggesting whales and institutions may be positioning for a bigger move.
—
How Expansion Could Unfold: What’s Next for SOL?
Solana’s price tightly hugs a consolidation range, typical for periods that precede explosive surges. Above, the $176 resistance stands tall—formed by both the 200-day moving average and the market’s Point of Control (PoC). A forceful close above this barrier could light the fuse, propelling SOL first toward the psychological $200 milestone, and then aiming straight at the $240 “value area high.”
Investor focus is shifting to volume—watch for a spike if $176 cracks. Historical data reveals that breakouts accompanied by swelling volume usually confirm the rally’s authenticity and often lead to swift follow-through in trending markets.
—
Q: What Technical Signals Confirm the Bullish Case?
Momentum is surging. The Stochastics RSI recently flashed a bullish crossover from oversold territory. This indicator, which regularly precedes sustained runs in SOL, is curving upward again—a pattern that has sparked significant rallies in earlier market cycles.
Trading volume has dropped slightly during the current chop, a classic sign of accumulation and a possible clue that the “smart money” is loading up before another climb. If volume suddenly accelerates on an upside breakout, expect fireworks.
—
How to Navigate Solana’s Next Move?
– Track the $176 resistance; a daily close above with conviction could confirm the breakout.
– Volume remains king: Rising volume plus a trend breakout = high-probability move.
– Keep an eye on the 0.618 Fibonacci ($156–$160) for support. Bulls must defend this fortress to keep the uptrend alive.
– Short-term failure here may just mean more sideways action, but a breakdown below $148 calls for caution.
For the latest market data, analysis, and updates on cryptocurrencies like Solana, visit CoinDesk or check the tools and charts at TradingView.
—
Ready to Ride the Potential Rally?
Set your alerts and prepare a strategy. Solana is at a tipping point—if buyers keep control, $240 could arrive sooner than expected.
Solana Breakout Checklist:
– Watch for daily close above $176 resistance
– Confirm bullish Stochastics RSI signal persists
– Monitor for volume surge on breakout
– Hold support at $156–$160 Fibonacci zone
– Consider risk control if $148 breaks down
Stay sharp, act fast, and always manage your risk as Solana’s next chapter unfolds!


